HUD Elements
Claude HUD displays real-time information about your Claude Code session across multiple lines. Each element provides a specific piece of data — from context window health to tool activity and todo progress. This page explains every indicator, bar, and line you see in the HUD.
Prerequisites: You should have Claude HUD installed and running. See Getting Started for setup instructions.
Layout Modes
Claude HUD supports two layout modes that determine how elements are arranged:
Expanded Layout (Default)
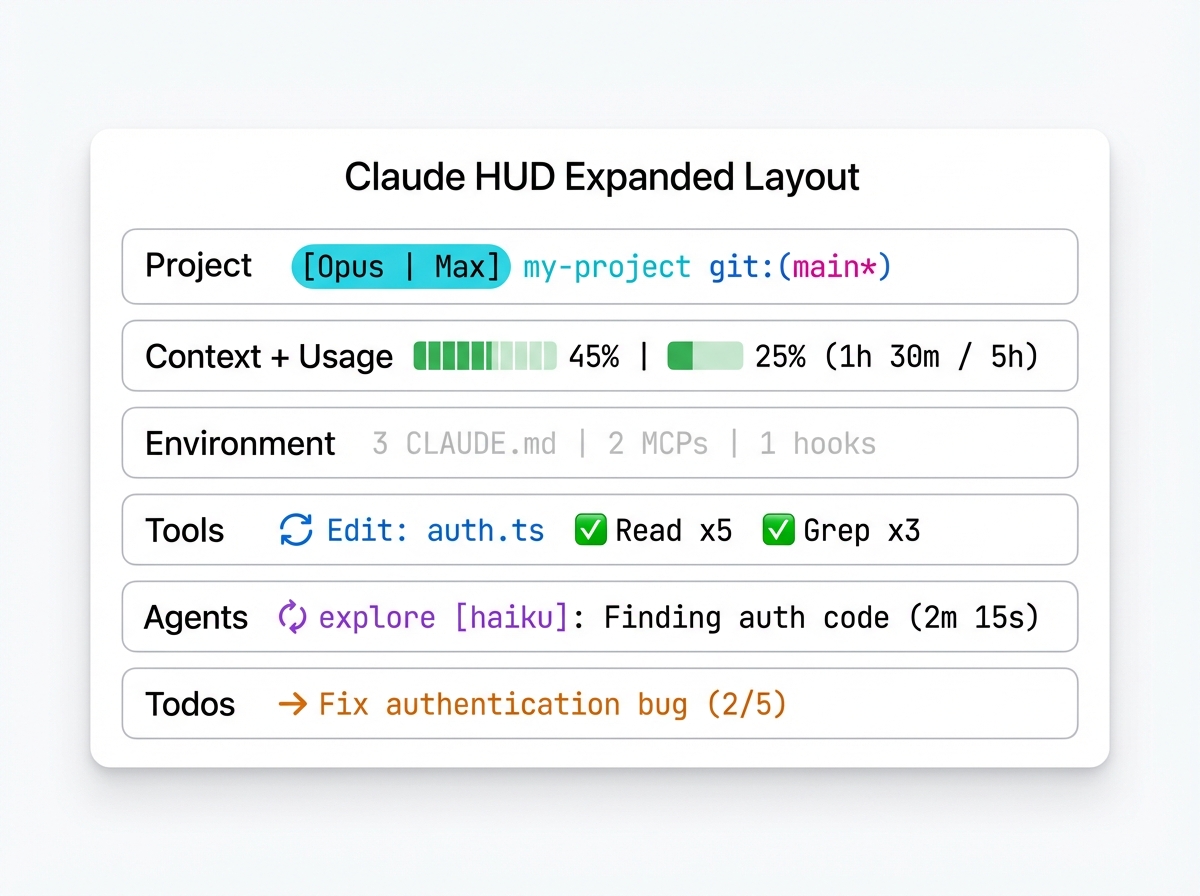
In expanded layout, each element category gets its own line. The order is controlled by the elementOrder configuration:
[Opus | Max] │ my-project git:(main*)
Context █████░░░░░ 45% │ Usage ██░░░░░░░░ 25% (1h 30m / 5h)
3 CLAUDE.md | 2 MCPs | 1 hooks
◐ Edit: auth.ts | ✓ Read ×3 | ✓ Grep ×2
◐ explore [haiku]: Finding auth code (2m 15s)
▸ Fix authentication bug (2/5)
The seven element categories are: project, context, usage, environment, tools, agents, and todos. When context and usage appear next to each other in elementOrder, they merge onto a single line separated by │.
Compact Layout
In compact layout, all session information collapses into a single line, with activity lines (tools, agents, todos) shown below:
[Opus | Max] █████░░░░░ 45% | my-project git:(main*) | 3 CLAUDE.md | ██░░░░░░░░ 25% (1h 30m / 5h) | ⏱️ 5m
◐ Edit: auth.ts | ✓ Read ×3
Switch between layouts with:
{ "lineLayout": "expanded" }
{ "lineLayout": "compact" }
Project Line
The project line shows your model, working directory, and git status. It appears as the first line in both layouts.
Model Badge
Displays the active model name and billing source:
[Opus | Max]        ← Model name + plan (Pro/Max/Team)
[Opus | API]        ← Model name + API key billing
[Opus | Bedrock]    ← Model name + AWS Bedrock provider
[Opus]              ← Model name only (no plan detected)
The model name comes from Claude Code’s stdin JSON data. The billing label is determined by:
- Provider label (e.g.,
Bedrock) — shown first if available - Plan name (e.g.,
Max,Pro) — from the usage API - API indicator — shown as red
APIwhenANTHROPIC_API_KEYis set
Toggle with display.showModel (default: true).
Project Path
Shows the current working directory, truncated to a configurable number of path levels:
my-project              ← pathLevels: 1 (default)
apps/my-project         ← pathLevels: 2
dev/apps/my-project     ← pathLevels: 3
Configure with:
{ "pathLevels": 2 }
Toggle with display.showProject (default: true).
Git Status
Displays the current branch and optional change indicators:
git:(main)              ← Clean branch
git:(main*)             ← Uncommitted changes (dirty)
git:(main ↑2 ↓1)       ← Ahead/behind remote
git:(main* !3 +1 ✘2 ?4)← Full file stats
File stat symbols:
| Symbol | Meaning |
|---|---|
* |
Uncommitted changes exist |
↑N |
N commits ahead of remote |
↓N |
N commits behind remote |
!N |
N modified files |
+N |
N added/staged files |
✘N |
N deleted files |
?N |
N untracked files |
Configure git display:
{
  "gitStatus": {
    "enabled": true,
    "showDirty": true,
    "showAheadBehind": true,
    "showFileStats": true
  }
}
Session Name
When enabled, shows the session slug or a custom title set via /rename:
[Opus | Max] │ my-project git:(main) │ fix-auth-flow
Toggle with display.showSessionName (default: false).
Context Line
The context line shows how much of your context window is in use. This is one of the most important indicators — when context fills up, Claude Code triggers an auto-compact that clears conversation history.
Context Bar
A 10-character visual bar that fills from left to right as context usage increases:
Context █████░░░░░ 45%     ← Green: healthy
Context ███████░░░ 70%     ← Yellow: warning
Context █████████░ 90%     ← Red: critical
Color thresholds:
| Percent | Color | Meaning |
|---|---|---|
| 0-69% | Green | Healthy — plenty of room |
| 70-84% | Yellow | Warning — consider wrapping up complex tasks |
| 85-100% | Red | Critical — auto-compact may trigger soon |
Toggle with display.showContextBar (default: true).
Context Value Display
The numeric value next to the bar can show three different formats:
Context █████░░░░░ 45%          ← percent (default)
Context █████░░░░░ 45k/200k    ← tokens
Context █████░░░░░ 55%          ← remaining
Configure with:
{ "display": { "contextValue": "percent" } }
Valid values: "percent", "tokens", "remaining".
Token Breakdown
When context usage reaches 85% or higher, a token breakdown automatically appears showing input tokens and cache usage:
Context █████████░ 90% (in: 180k, cache: 45k)
This helps you understand what is consuming context space. Token counts are formatted as k (thousands) or M (millions).
Toggle with display.showTokenBreakdown (default: true).
Autocompact Buffer
By default, Claude HUD accounts for the autocompact buffer when calculating context percentage. This means the displayed percentage reflects usable context rather than raw usage:
enabled(default): Percentage accounts for the autocompact buffer, giving you a more accurate picture of when auto-compact will triggerdisabled: Shows raw token percentage without buffer adjustment
{ "display": { "autocompactBuffer": "disabled" } }
Usage Line
The usage line tracks your rate limit consumption for Pro, Max, and Team plans. It displays two usage windows: 5-hour and 7-day.
5-Hour Window
Always shown when usage data is available:
Usage ██░░░░░░░░ 25% (1h 30m / 5h)
The bar and percentage show how much of your 5-hour rate limit has been consumed. The time in parentheses shows when the window resets.
7-Day Window
Appears when 7-day usage exceeds the sevenDayThreshold (default: 80%):
Usage ██░░░░░░░░ 25% (1h 30m / 5h) | ██████████ 85% (2d / 7d)
Configure the threshold:
{ "display": { "sevenDayThreshold": 50 } }
Set to 0 to always show the 7-day window.
Usage Color Scale
Usage bars use a separate color scale from the context bar:
| Percent | Color | Meaning |
|---|---|---|
| 0-74% | Bright blue | Normal usage |
| 75-89% | Bright magenta | Approaching limit |
| 90-100% | Red | Near or at limit |
Usage Threshold
Hide the usage display when usage is below a threshold:
{ "display": { "usageThreshold": 20 } }
With this setting, the usage line only appears when usage reaches 20% or higher.
Limit Reached State
When either usage window hits 100%, the display changes to a critical warning:
Usage ⚠ Limit reached (resets 45m)
The reset time tells you how long until the window resets.
Text-Only Mode
Disable usage bars to show text-only labels:
{ "display": { "usageBarEnabled": false } }
Result:
Usage 5h: 25% (1h 30m) | 7d: 85% (2d)
Who Sees Usage
Usage display requires an Anthropic subscription (Pro, Max, or Team). It does not appear for:
- API key users (pay-per-token billing, no rate limits)
- AWS Bedrock or custom base URL users (usage managed elsewhere)
Toggle with display.showUsage (default: true).
Environment Line
The environment line shows counts of active Claude Code configuration sources:
3 CLAUDE.md | 2 rules | 4 MCPs | 1 hooks
| Indicator | What It Counts |
|---|---|
N CLAUDE.md |
Number of CLAUDE.md files loaded in the session |
N rules |
Number of active rules files |
N MCPs |
Number of connected MCP servers |
N hooks |
Number of configured hooks |
Only non-zero counts are displayed. The entire line is hidden when all counts are zero.
Environment Threshold
Control when the environment line appears:
{ "display": { "environmentThreshold": 3 } }
The line only shows when the total count (CLAUDE.md + rules + MCPs + hooks) reaches the threshold. Default is 0 (always show when there is any count).
Toggle with display.showConfigCounts (default: false in expanded, varies in compact).
Tools Line
The tools line shows real-time tool invocations during Claude’s work. It displays both currently running tools and a summary of recently completed ones.
Running Tools
Active tools show a spinning indicator and the tool name with its target:
◐ Edit: auth.ts | ◐ Read: config.json
Up to 2 running tools are displayed at once. The target path is truncated to 20 characters, showing the filename when the path is too long:
◐ Edit: .../deeply-nested-file.ts
Completed Tools
Completed tools show a checkmark with an invocation count, sorted by frequency:
✓ Read ×5 | ✓ Edit ×3 | ✓ Grep ×2 | ✓ Bash ×1
Up to 4 completed tool summaries are shown, prioritizing the most frequently used tools.
Combined Display
When both running and completed tools exist:
◐ Edit: auth.ts | ✓ Read ×5 | ✓ Grep ×3 | ✓ Bash ×2
The tools line is hidden when no tools have been invoked.
Toggle with display.showTools (default: false).
Agents Line
The agents line tracks sub-agents spawned by Claude Code during complex tasks. It displays both running and recently completed agents.
Running Agents
Active agents show a spinning indicator, the agent type, optional model, description, and elapsed time:
◐ explore [haiku]: Finding authentication code (2m 15s)
| Part | Description |
|---|---|
◐ |
Yellow spinning indicator — agent is running |
explore |
Agent type (shown in magenta) |
[haiku] |
Model being used (dimmed, optional) |
Finding authentication... |
Task description (truncated to 40 chars) |
(2m 15s) |
Elapsed time since agent started |
Completed Agents
Recently completed agents show a checkmark:
✓ explore [haiku]: Found 3 auth modules (45s)
Up to 2 recently completed agents are shown alongside running agents, with a maximum of 3 total entries visible at once.
Time Format
Elapsed time is displayed in a human-readable format:
| Duration | Display |
|---|---|
| Under 1 second | <1s |
| Under 1 minute | Ns (e.g., 45s) |
| 1 minute or more | Nm Ns (e.g., 2m 15s) |
The agents line is hidden when no agents have been active.
Toggle with display.showAgents (default: false).
Todos Line
The todos line tracks task completion when Claude Code uses its internal todo list to manage multi-step work.
In-Progress Todo
Shows the currently active todo item with a progress counter:
▸ Fix authentication bug (2/5)
| Part | Description |
|---|---|
▸ |
Yellow pointer — this task is in progress |
Fix authentication... |
Todo content (truncated to 50 chars) |
(2/5) |
Completed / total todo count |
All Complete
When every todo is marked done:
✓ All todos complete (5/5)
The todos line is hidden when no todo items exist or when no item is currently in progress (and not all are complete).
Toggle with display.showTodos (default: false).
Additional Indicators
Session Duration
Shows how long the current session has been running:
⏱️ 5m
Toggle with display.showDuration (default: false).
Output Speed
Shows the token output speed in tokens per second:
out: 42.1 tok/s
Toggle with display.showSpeed (default: false).
Color Customization
All color-coded elements can be customized through the colors configuration:
{
  "colors": {
    "context": "cyan",
    "usage": "cyan",
    "warning": "yellow",
    "usageWarning": "magenta",
    "critical": "red"
  }
}
| Color Key | Applies To | Default |
|---|---|---|
context |
Context bar and percentage (normal range) | green |
usage |
Usage bar and percentage (normal range) | brightBlue |
warning |
Context at 70-84%, usage warnings | yellow |
usageWarning |
Usage at 75-89% | brightMagenta |
critical |
Context at 85%+, usage at 90%+, limit reached | red |
Available color names: red, green, yellow, magenta, cyan, brightBlue, brightMagenta.
Element Order
In expanded layout, control which elements appear and in what order:
{
  "elementOrder": ["project", "tools", "context", "usage", "environment", "agents", "todos"]
}
Omitting an element from the array hides it in expanded mode. The default order is:
project— Model badge, project path, git statuscontext— Context window bar and percentageusage— Rate limit consumptionenvironment— Configuration source countstools— Tool invocation activityagents— Sub-agent trackingtodos— Todo progress
Separators
Add a visual separator line between info elements and activity elements:
{ "showSeparators": true }
[Opus | Max] │ my-project git:(main)
Context █████░░░░░ 45% │ Usage ██░░░░░░░░ 25%
────────────────────────────────
◐ Edit: auth.ts | ✓ Read ×3
▸ Fix authentication bug (2/5)
Related Topics
- Configuration — Full reference for all configuration options
- Getting Started — Install and set up Claude HUD
- Troubleshooting — Fix display issues and missing elements
- Architecture — How the rendering pipeline works under the hood